Blueprint: Ship Movement Analysis (React.js)
A Geobase quickstart blueprint application showing animated ship trails.
Video Tutorial
Watch the complete tutorial on building this blueprint:
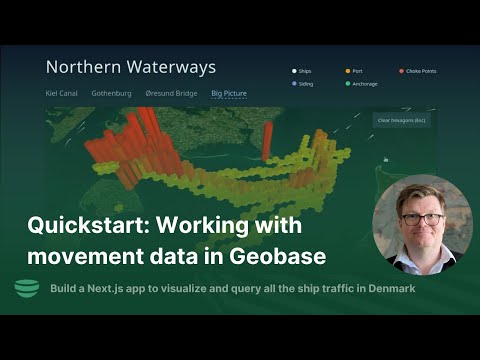
🎥 Take a look at the blueprint overview video on YouTube
Repository
Access the complete source code and detailed setup instructions:
What’s Included
This React and Geobase application features:
- Animated ship movements displayed on an interactive map
- PostgreSQL extensions: MobilityDb, H3, and PostGIS built into Geobase
- Interactive data querying to calculate aggregate statistics
- Quick setup with minimal editing required for temporal geospatial data
About AIS Data
- AIS (Automatic Identification System): Location tracking system for sea vessels
- Rich data fields: Like GPS but with many additional vessel information fields
- Pre-loaded dataset: Ready-to-use data already uploaded to Geobase
- Processing pipeline: Imports, processes, and serves data as temporal vector tiles
Key Features
- Deck.gl visualization: Vector tiles displayed on a Maplibre map
- Polygon querying: Draw shapes on the map to analyze regional activity
- Hexagonal display: Shows ship activity amounts using hexagon overlays
Last updated on